A SOC team usually has a red team and a blue team. It is always a good idea to practice TTPs(techniques, tactics, procedures), generate IOCs so that you can understand how an attack works and what noise it generates, and set up automation to start practicing analyzing and responding to these issues, with the aim to learn how to respond to security threats faster.
In this blog, we will walk you through a few tools and guide you on how to set up a home lab for both the red team and the blue team.
Red Team:
- Attack simulation (Caldera)
Blue Team:
- Network monitoring set up (PfSense/Suricata)
- SIEM set up (Splunk)
- XDR and security automation (DTonomy)
Lab Setup: A Kali Linux VM acting as a C2C Server using Caldera and a Windows 10 VM as a victim with Caldera RAT agent and Splunk’s Monitoring agent (Splunk Universal Forwarder). Both the machines are connected via an internal network. Once set up, consolidate your security threats in DTonomy’s AIR platform and start automating all your defense operations.
Red Team- Attack Simulation:
Caldera is a cyber security framework designed to easily run autonomous breach simulation exercises. It is used to automate adversary emulation and incident response. The core framework consists of an asynchronous command-and-control (C2) server with a REST API and a web interface. Caldera also supports plugins that expand the core framework capabilities and provides additional functionalities. Its main use is to test endpoint solutions.
Installing Caldera
Installing Caldera is a very straightforward process and should take around 10 minutes or less. Start by cloning the repository in the desired folder.
git clone https://github.com/mitre/caldera.git — recursive — branch 3.0.0
Navigate to the caldera folder and install all the requirements
pip3 install -r requirements.txtFrom within the folder itself, start the Caldera Server GUI
python3 server.py –insecure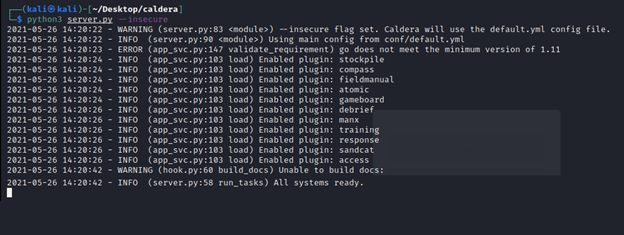
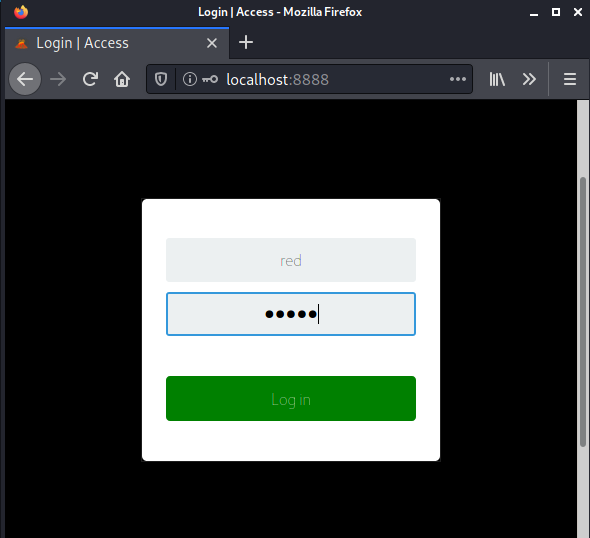
Now, login to the Caldera Server GUI on http://localhost:8888 using the credentials, red: admin.
Establish Caldera agents
Caldera agents are Remote Access Tools (RATs), allowing to execution of benign commands which simulate adversarial behavior. Using the GUI navigate to agents and Add agents.
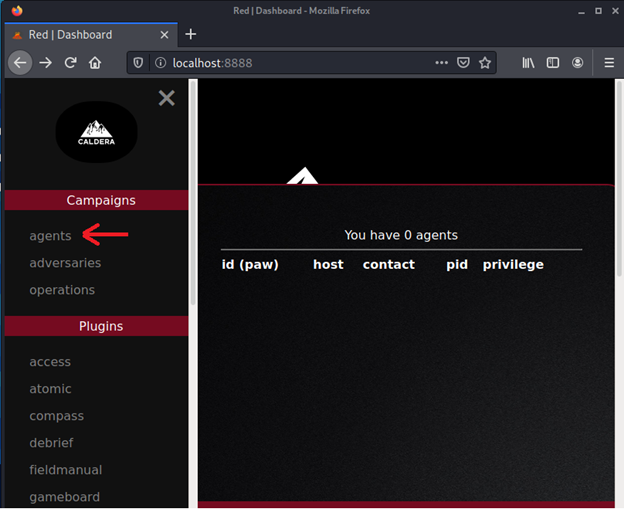
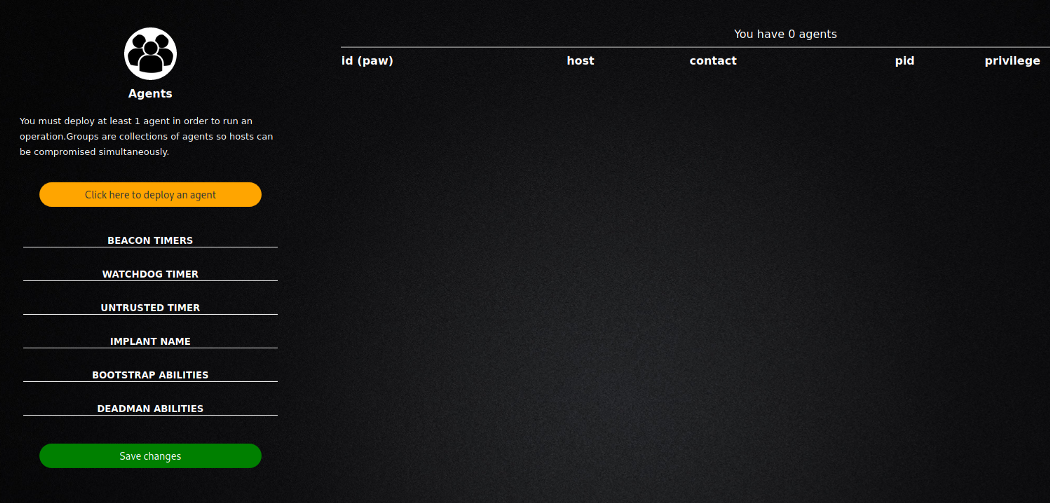
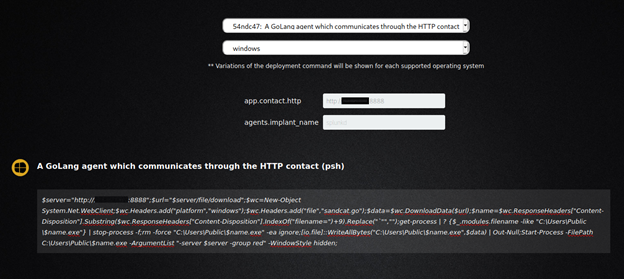
Now, select 54ndc47 (SandCat) as your agent and select the OS, add the host system’s IP address in-app.contact.http, and append port 8888 at the end (default listening port for Caldera). Then head over to the Victim machine/Endpoint. For windows, paste the command in PowerShell (admin privileges are optional) and for Ubuntu/Debian paste the command in the terminal.
Launch an Adversarial Operation
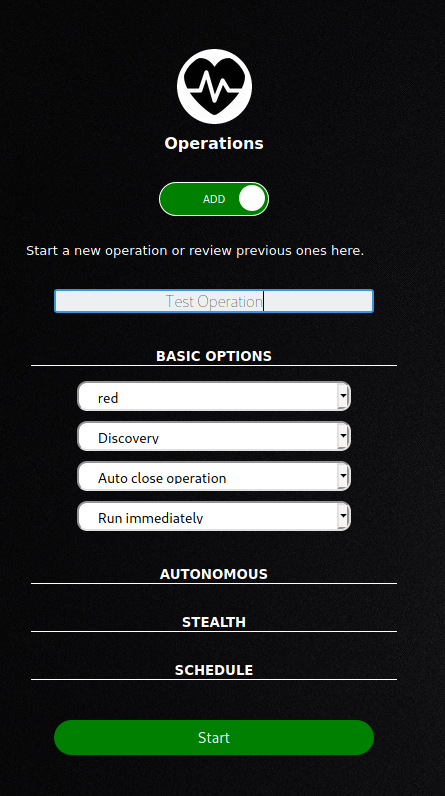
Now, we have everything ready to carry out our Adversarial attacks using Caldera. It has many pre-defined Adversarial Plans which are just to get us to understand the system. The best ones to start are “The Discovery” or “The Hunter”.
From the menu navigate to “Operations”, and toggle the switch to “Add”. Type a name for the operation. Under the basic operations, select the adversary plan and change “Keep open forever” to “Auto close operation”. Press Start to begin your attack.
Now let’s get started setting up the blue team tool.
Blue Team Setup:
Network monitoring set up(PfSense)
pfSense is a free and open-source operating system for routers and firewalls. pfSense can be installed on most commodity hardware, including old computers and embedded systems.
Follow the instruction here to set up pfSense.
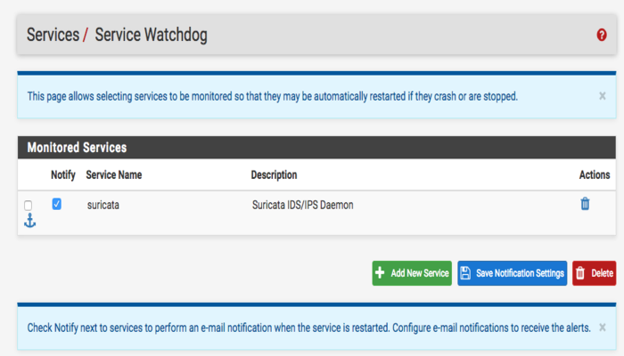
Once pfSense is done, you can quickly configure Suricata to start detecting attacks on pfSense. Suricata is an open-source detection engine that can act as intrusion detection and intrusion prevention system. pfSense has a Suricata module, which you can install quickly and start detecting.
Follow the instructions here to enable Suricata on pfSense.
See detections in SIEM
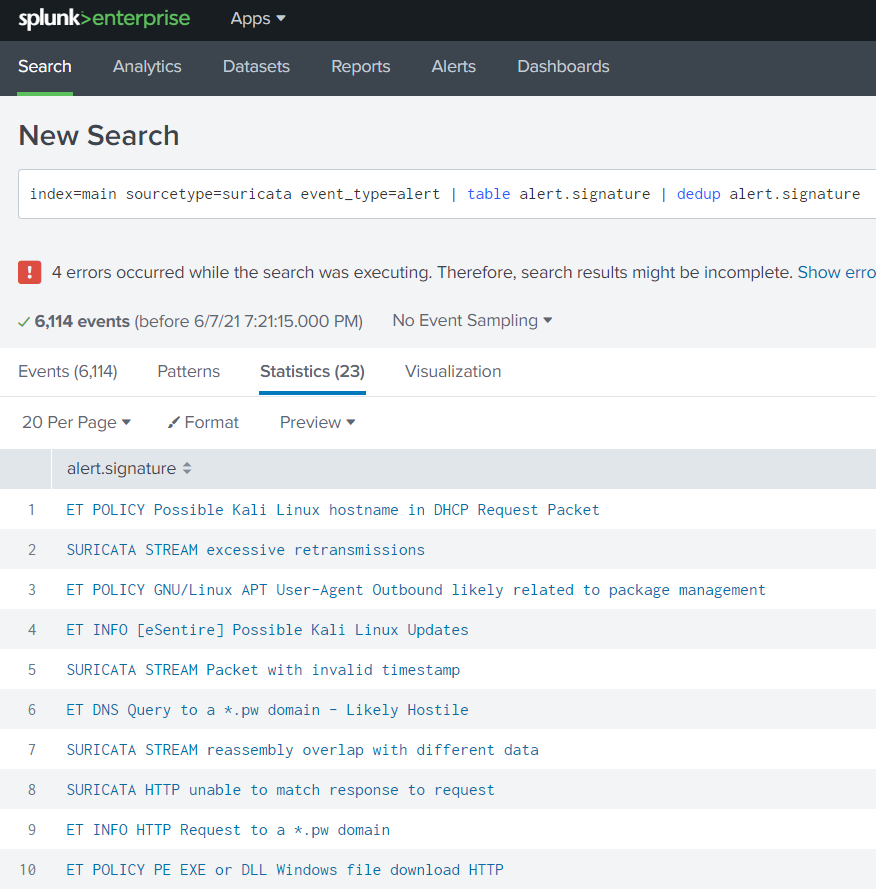
Leverage Splunk freemium version to set up an instance. You can install Splunk’s Monitoring agent ( Splunk Universal Forwarder) to forward detections to view in Splunk. (Set up forwarder here Universal Forwarder for Remote Data Collection)
Once installed, you can start to see Detections in Splunk
Manage and respond to security threats automatically via DTonomy AIR
DTonomy AIR enables consolidating security threats, streamlining security investigation and response, and automates security operations. Sign up DTonomy freemium edition here.
Here we will set up an automation to automatically block an IP once an alert is triggered.
Set up DTonomy connector to Splunk
The first step is to pull security alerts from different tools, endpoints, networks, etc. Here let’s configure the DTonomy connector to pull all threats from Splunk.
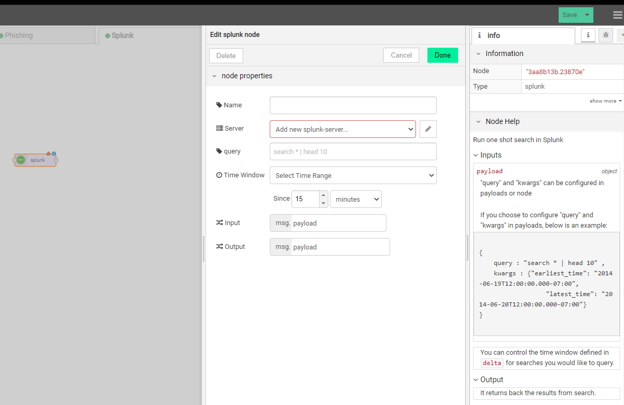
Then, let’s set up a workflow to block IP in pfSense.
The automatic command to block IP via pfSense is here: (Reference is here)
"8 \n easyrule block wan %1 \n exit \n 0"Since you are using DTonomy in the cloud, let’s use an SSH node to connect to your local instance and type in this command in the SSH node to block your IP automatically once detection is triggered.

Now you have a full end-to-end home lab set up and ready to run your home security experiment.
Stay tuned. More on threat hunting, detection, investigation, and response!
When you are ready, here are three things we can help with:
Additional Resources:
Try out DTonomy Automation Community Edition and Start automation tasks for your SOC team today!
Use Osquery for endpoint detection and response – AI-Based Analysis and Response

